


New map highlights sinking Louisiana coast
The map, published in GSA Today, a monthly open-access publication of the Geological Society of America, has long been considered the “holy grail” by researchers and policy makers as they look for solutions to the coastal wetland loss crisis, the researchers said.
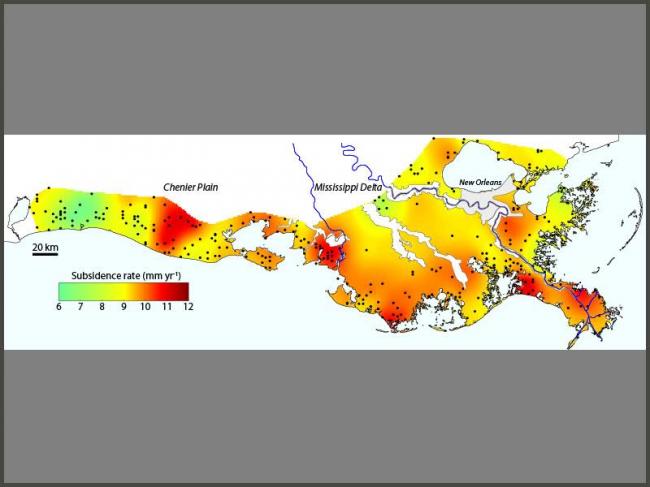
“The novel aspect of this study is that it provides a map that shows subsidence rates as observed at the land surface,” said Torbjörn Törnqvist, professor of geology and chair of the Department of Earth and Environmental Sciences at Tulane University.
“This sets it apart from previous attempts to map subsidence rates.”
Jaap Nienhuis, a postdoctoral fellow in earth and environmental sciences, is the lead author of the study. He said that while the present-day subsidence rate averages about 9 millimeters, or just over a third of an inch each year, there is plenty of variability among specific sites along the coast.
“This information will be valuable for policy decisions about coastal restoration, such as planning of large sediment diversions that are intended to make portions of Louisiana’s coast more sustainable,” Nienhuis said.
The researchers used data obtained by a network of hundreds of instruments known as surface-elevation tables, scattered along the Louisiana coast. These instruments enabled the Tulane team to calculate subsidence rates in the shallow subsurface (up to about 10 meters or 30 feet depth) where most of the subsidence happens. This large network of surface-elevation tables was installed during the post-Katrina period, so determining subsidence rates with this method has only recently become possible.
The research was made possible through publicly available data collected through the Coastal Wetland Planning, Protection, and Restoration Act Program and the State of Louisiana. Funding was provided by the Geomorphology program of the National Science Foundation.
Image: Tulane University
Support Our Journalism
We cannot do without you.. your contribution supports unbiased journalism
IBNS is not driven by any ism- not wokeism, not racism, not skewed secularism, not hyper right-wing or left liberal ideals, nor by any hardline religious beliefs or hyper nationalism. We want to serve you good old objective news, as they are. We do not judge or preach. We let people decide for themselves. We only try to present factual and well-sourced news.
Support objective journalism for a small contribution.


