

New Greenland maps show more glaciers at risk
California, Nov 4 (IBNS): New maps of Greenland’s coastal seafloor and bedrock beneath its massive ice sheet show that two to four times as many coastal glaciers are at risk of accelerated melting as had previously been thought.
Researchers at the University of California, Irvine, NASA and 30 other institutions have published the most comprehensive, accurate and high-resolution relief maps ever made of Greenland’s bedrock and coastal seafloor. Among the many data sources incorporated into the new maps is data from NASA’s Ocean Melting Greenland campaign.
Lead author Mathieu Morlighem of UCI had demonstrated in an earlier study that data from OMG’s survey of the shape and depth, or bathymetry, of the seafloor in Greenland’s fjords improved scientists’ understanding of both the coastline and the inland bedrock beneath glaciers that flow into the ocean. That’s because the bathymetry at a glacier’s front limits the possibilities for the shape of bedrock farther upstream.
The nearer to the shoreline, the more valuable the bathymetry data are for understanding on-shore topography, Morlighem said. “What made OMG unique compared to other campaigns is that they got right into the fjords, as close as possible to the glacier fronts. That’s a big help for bedrock mapping,” he added.
Additionally, the OMG campaign surveyed large sections of the Greenland coast for the first time ever. In fjords for which there are no data, it’s difficult to estimate how deep the glaciers extend below sea level, read the University of California website.
The OMG data are only one of many datasets Morlighem and his team used in the ice sheet mapper, which is named BedMachine. Another comprehensive source is NASA’s Operation IceBridge airborne surveys. IceBridge measures the ice sheet thickness directly along a plane’s flight path. This creates a set of long, narrow strips of data rather than a complete map of the ice sheet.
Besides NASA, almost 40 other international collaborators also contributed various types of survey data on different parts of Greenland.
No survey, not even OMG, covers every glacier on Greenland’s long, convoluted coastline. To infer the bed topography in sparsely studied areas, BedMachine averages between existing data points using physical principles such as the conservation of mass.
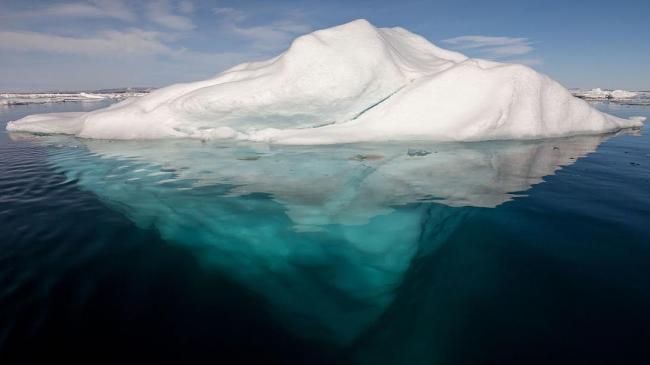
The new maps reveal that two to four times more oceanfront glaciers extend deeper than 600 feet (200 meters) below sea level than earlier maps showed. That’s bad news, because the top 600 feet of water around Greenland comes from the Arctic and is relatively cold. The water below it comes from farther south and is 6 to 8 eight degrees Fahrenheit (3 to 4 degrees Celsius) warmer than the water above. Deeper-seated glaciers are exposed to this warmer water, which melts them more rapidly.
Morlighem’s team used the maps to refine their estimate of Greenland’s total volume of ice and its potential to add to global sea level rise if the ice were to melt completely, which is not expected to occur within the next few hundred years. The new estimate is higher by 2.76 inches (7 centimeters) for a total of 24.34 feet (7.42 meters).
OMG principal investigator Josh Willis of JPL, who was not involved in producing the maps, said, “These results suggest that Greenland’s ice is more threatened by changing climate than we had anticipated.”
On Oct. 23, the five-year OMG campaign completed its second annual set of airborne surveys to measure for the first time the amount that warm water around the island is contributing to the loss of the Greenland ice sheet. Besides the one-time bathymetry survey, OMG is collecting annual measurements of the changing height of the ice sheet and the ocean temperature and salinity in more than 200 fjord locations. Morlighem looks forward to improving BedMachine’s maps with data from the airborne surveys.
The maps and related research are in a paper titled “BedMachine v3: Complete bed topography and ocean bathymetry mapping of Greenland from multi-beam echo sounding combined with mass conservation” in Geophysical Research Letters. This project received support from NASA’s Cryospheric Sciences Program and the National Science Foundation’s ARCSS program.
Image: Wikimedia Commons
Support Our Journalism
We cannot do without you.. your contribution supports unbiased journalism
IBNS is not driven by any ism- not wokeism, not racism, not skewed secularism, not hyper right-wing or left liberal ideals, nor by any hardline religious beliefs or hyper nationalism. We want to serve you good old objective news, as they are. We do not judge or preach. We let people decide for themselves. We only try to present factual and well-sourced news.
Support objective journalism for a small contribution.