


Historical records may underestimate sea level rise
A research team led by Philip Thompson, associate director of the University of Hawaii Sea Level Center in the School of Ocean and Earth Science and Technology, Manoa, evaluated how various processes that cause sea level to change differently in different places may have affected past measurements.
The team also included scientists from NASA’s Jet Propulsion Laboratory, Pasadena, California, and Old Dominion University, Norfolk, Virginia, read the NASA website .
“It’s not that there’s something wrong with the instruments or the data,” said Thompson, “but for a variety of reasons, sea level does not change at the same pace everywhere at the same time. As it turns out, our best historical sea level records tend to be located where 20th century sea level rise was most likely less than the true global average.”
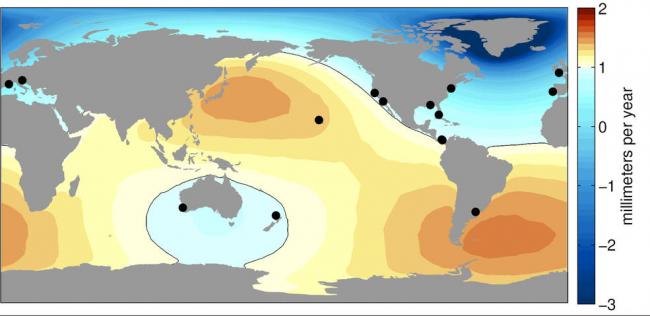
One of the key processes the researchers looked at is the effect of “ice melt fingerprints,” which are global patterns of sea level change caused by deviations in Earth’s rotation and local gravity that occur when a large ice mass melts. To determine the unique melt fingerprint for glaciers, ice caps and ice sheets, the team used data from NASA’s Gravity Recovery and Climate Experiment (GRACE) satellites on Earth’s changing gravitational field, and a novel modeling tool (developed by study co-author Surendra Adhikari and the JPL team) that simulates how ocean mass is redistributed due to ice melting.
One of the most fascinating and counter-intuitive features of these fingerprints is that sea level drops in the vicinity of a melting glacier, instead of rising as might be expected. The loss of ice mass reduces the glacier’s gravitational influence, causing nearby ocean water to migrate away. But far from the glacier, the water it has added to the ocean causes sea level to rise at a much greater rate.
During the 20th century, the dominant locations of global ice melt were in the Northern Hemisphere.
The results of this study showed that many of the highest-quality historical water level records are taken from places where the melt fingerprints of Northern Hemisphere sources result in reduced local sea level change compared to the global average.
Furthermore, the scientists found that factors capable of enhancing sea level rise at these locations, such as wind or Southern Hemisphere melt, were not likely to have counteracted the impact of fingerprints from Northern Hemisphere ice melt.
The study concludes it is highly unlikely that global average sea level rose less than 5.5 inches (14 centimeters) during the 20th century.
The most likely amount was closer to 6.7 inches (17 centimeters).
“This is really important, because it provides answers to the question about how melt fingerprints and the influence of wind on ocean circulation affect our ability to estimate past sea level rise,” said Thompson. “These results suggest that our longest records are most likely to underestimate past global mean change and allow us to establish the minimum amount of global sea level rise that could have occurred during the last century.”
Image Credits: University of Hawaii/NASA-JPL/Caltech
Support Our Journalism
We cannot do without you.. your contribution supports unbiased journalism
IBNS is not driven by any ism- not wokeism, not racism, not skewed secularism, not hyper right-wing or left liberal ideals, nor by any hardline religious beliefs or hyper nationalism. We want to serve you good old objective news, as they are. We do not judge or preach. We let people decide for themselves. We only try to present factual and well-sourced news.
Support objective journalism for a small contribution.


